Systems / Data Engineering
Building a Home Sensor Dashboard with Kafka, Postgres, and Metabase
The idea for this project is to monitor a terrarium's heat and humidity, and have it automatically adjust to match the weather conditions from a selected location. This write-up details Phase 1 of setting up monitoring, Phase 2 will focus on automating systems to control the conditions in the terrarium.
A Raspberry Pi publishes temperature and humidity readings every 30 seconds. A Debian home server ingests them through Kafka, stores them in Postgres, and surfaces them in Metabase.
Architecture Overview
The stack is deliberately simple: a producer, a broker, a consumer, a database, and a dashboard. Each layer is a separate concern and each failure mode is handled independently.
Two data streams feed the pipeline. The first is the DHT22 temperature/humidity sensor attached to a Raspberry Pi. The second is METAR weather data — aviation weather reports pulled periodically to give outdoor context. Both publish to their own Kafka topics and are consumed by separate Python services that write into Postgres.
The Sensor Producer
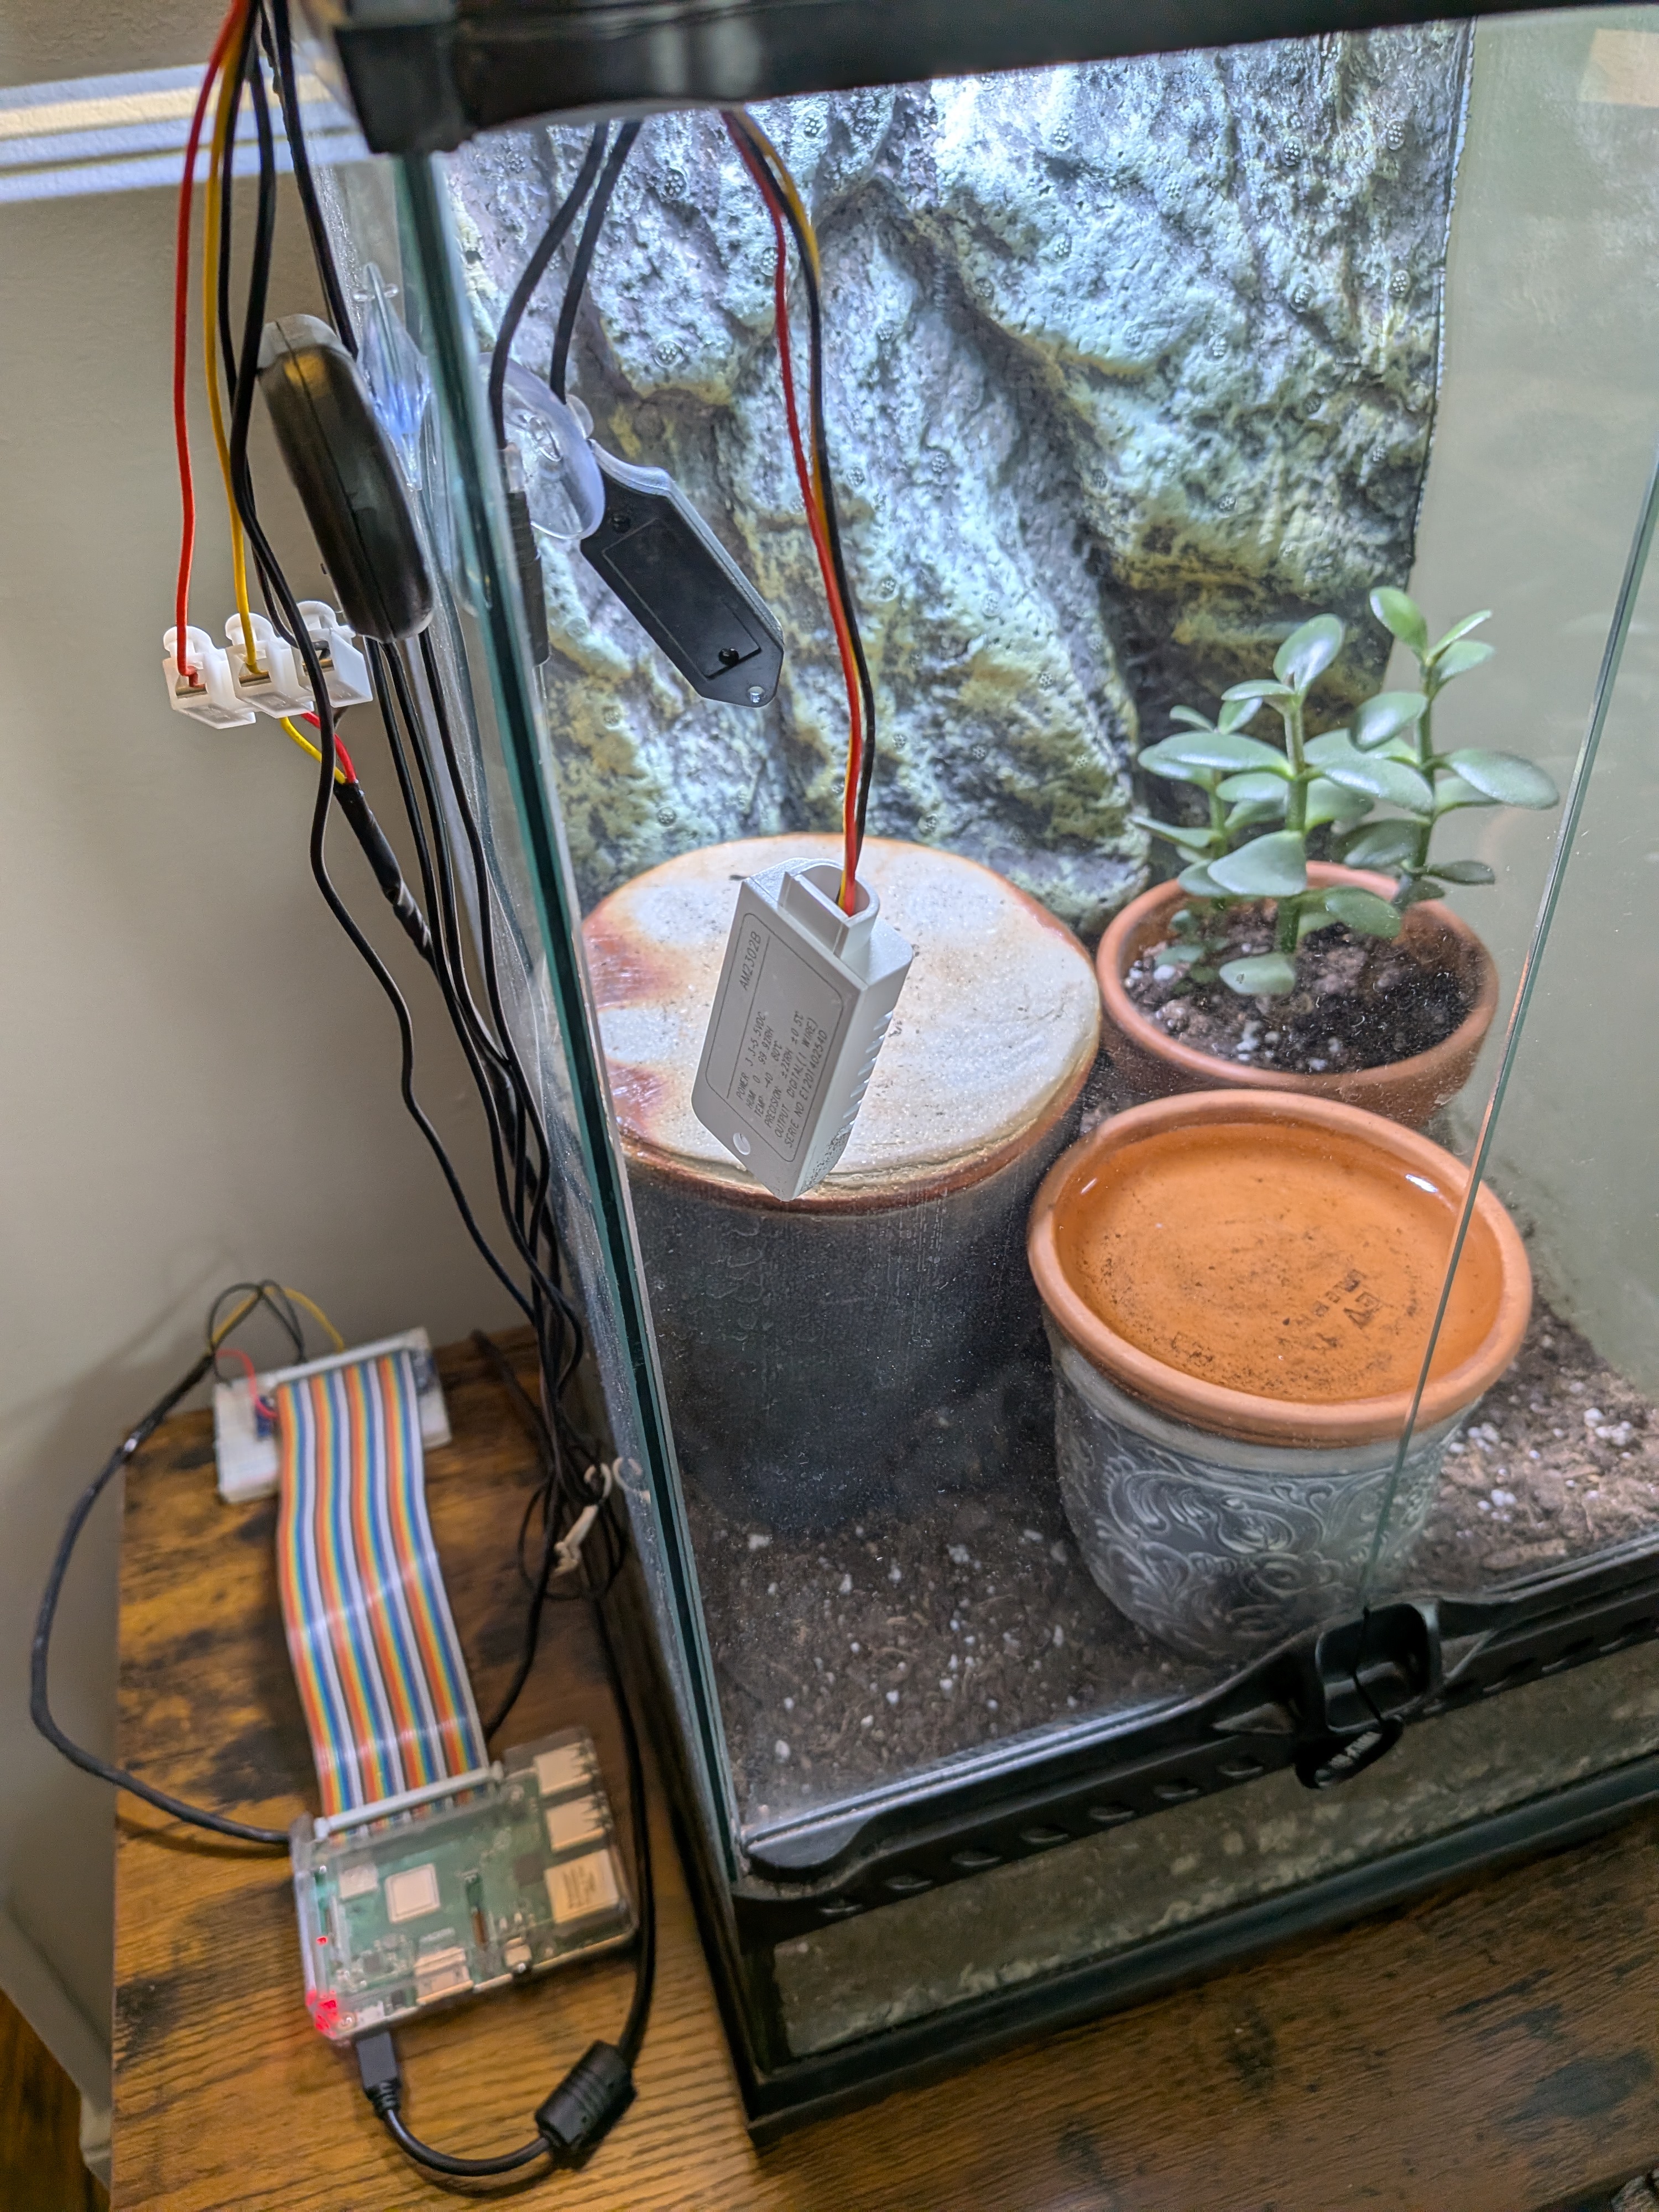
The Raspberry Pi runs dht22_publisher.py, a Python script that reads the
DHT22 and publishes a JSON message to the sensor-readings Kafka topic.
Early on it sampled every 3 seconds — about 28,000 writes per day — which was more than
the storage warranted, and the likely cause of the first machine's disk failure as the old hardware used as the server is not built for write intensive applications. Bumping the interval to 30 seconds brought that down to ~2,900
writes per day with no meaningful loss of resolution for temperature and humidity trends.
The publisher runs as a systemd service so it starts automatically on boot and restarts on failure. The Pi itself reboots nightly at 2am via a systemd timer — a simple hedge against the kinds of long-running process drift that creep in on embedded hardware.
[Timer]
OnCalendar=*-*-* 02:00:00
Persistent=true
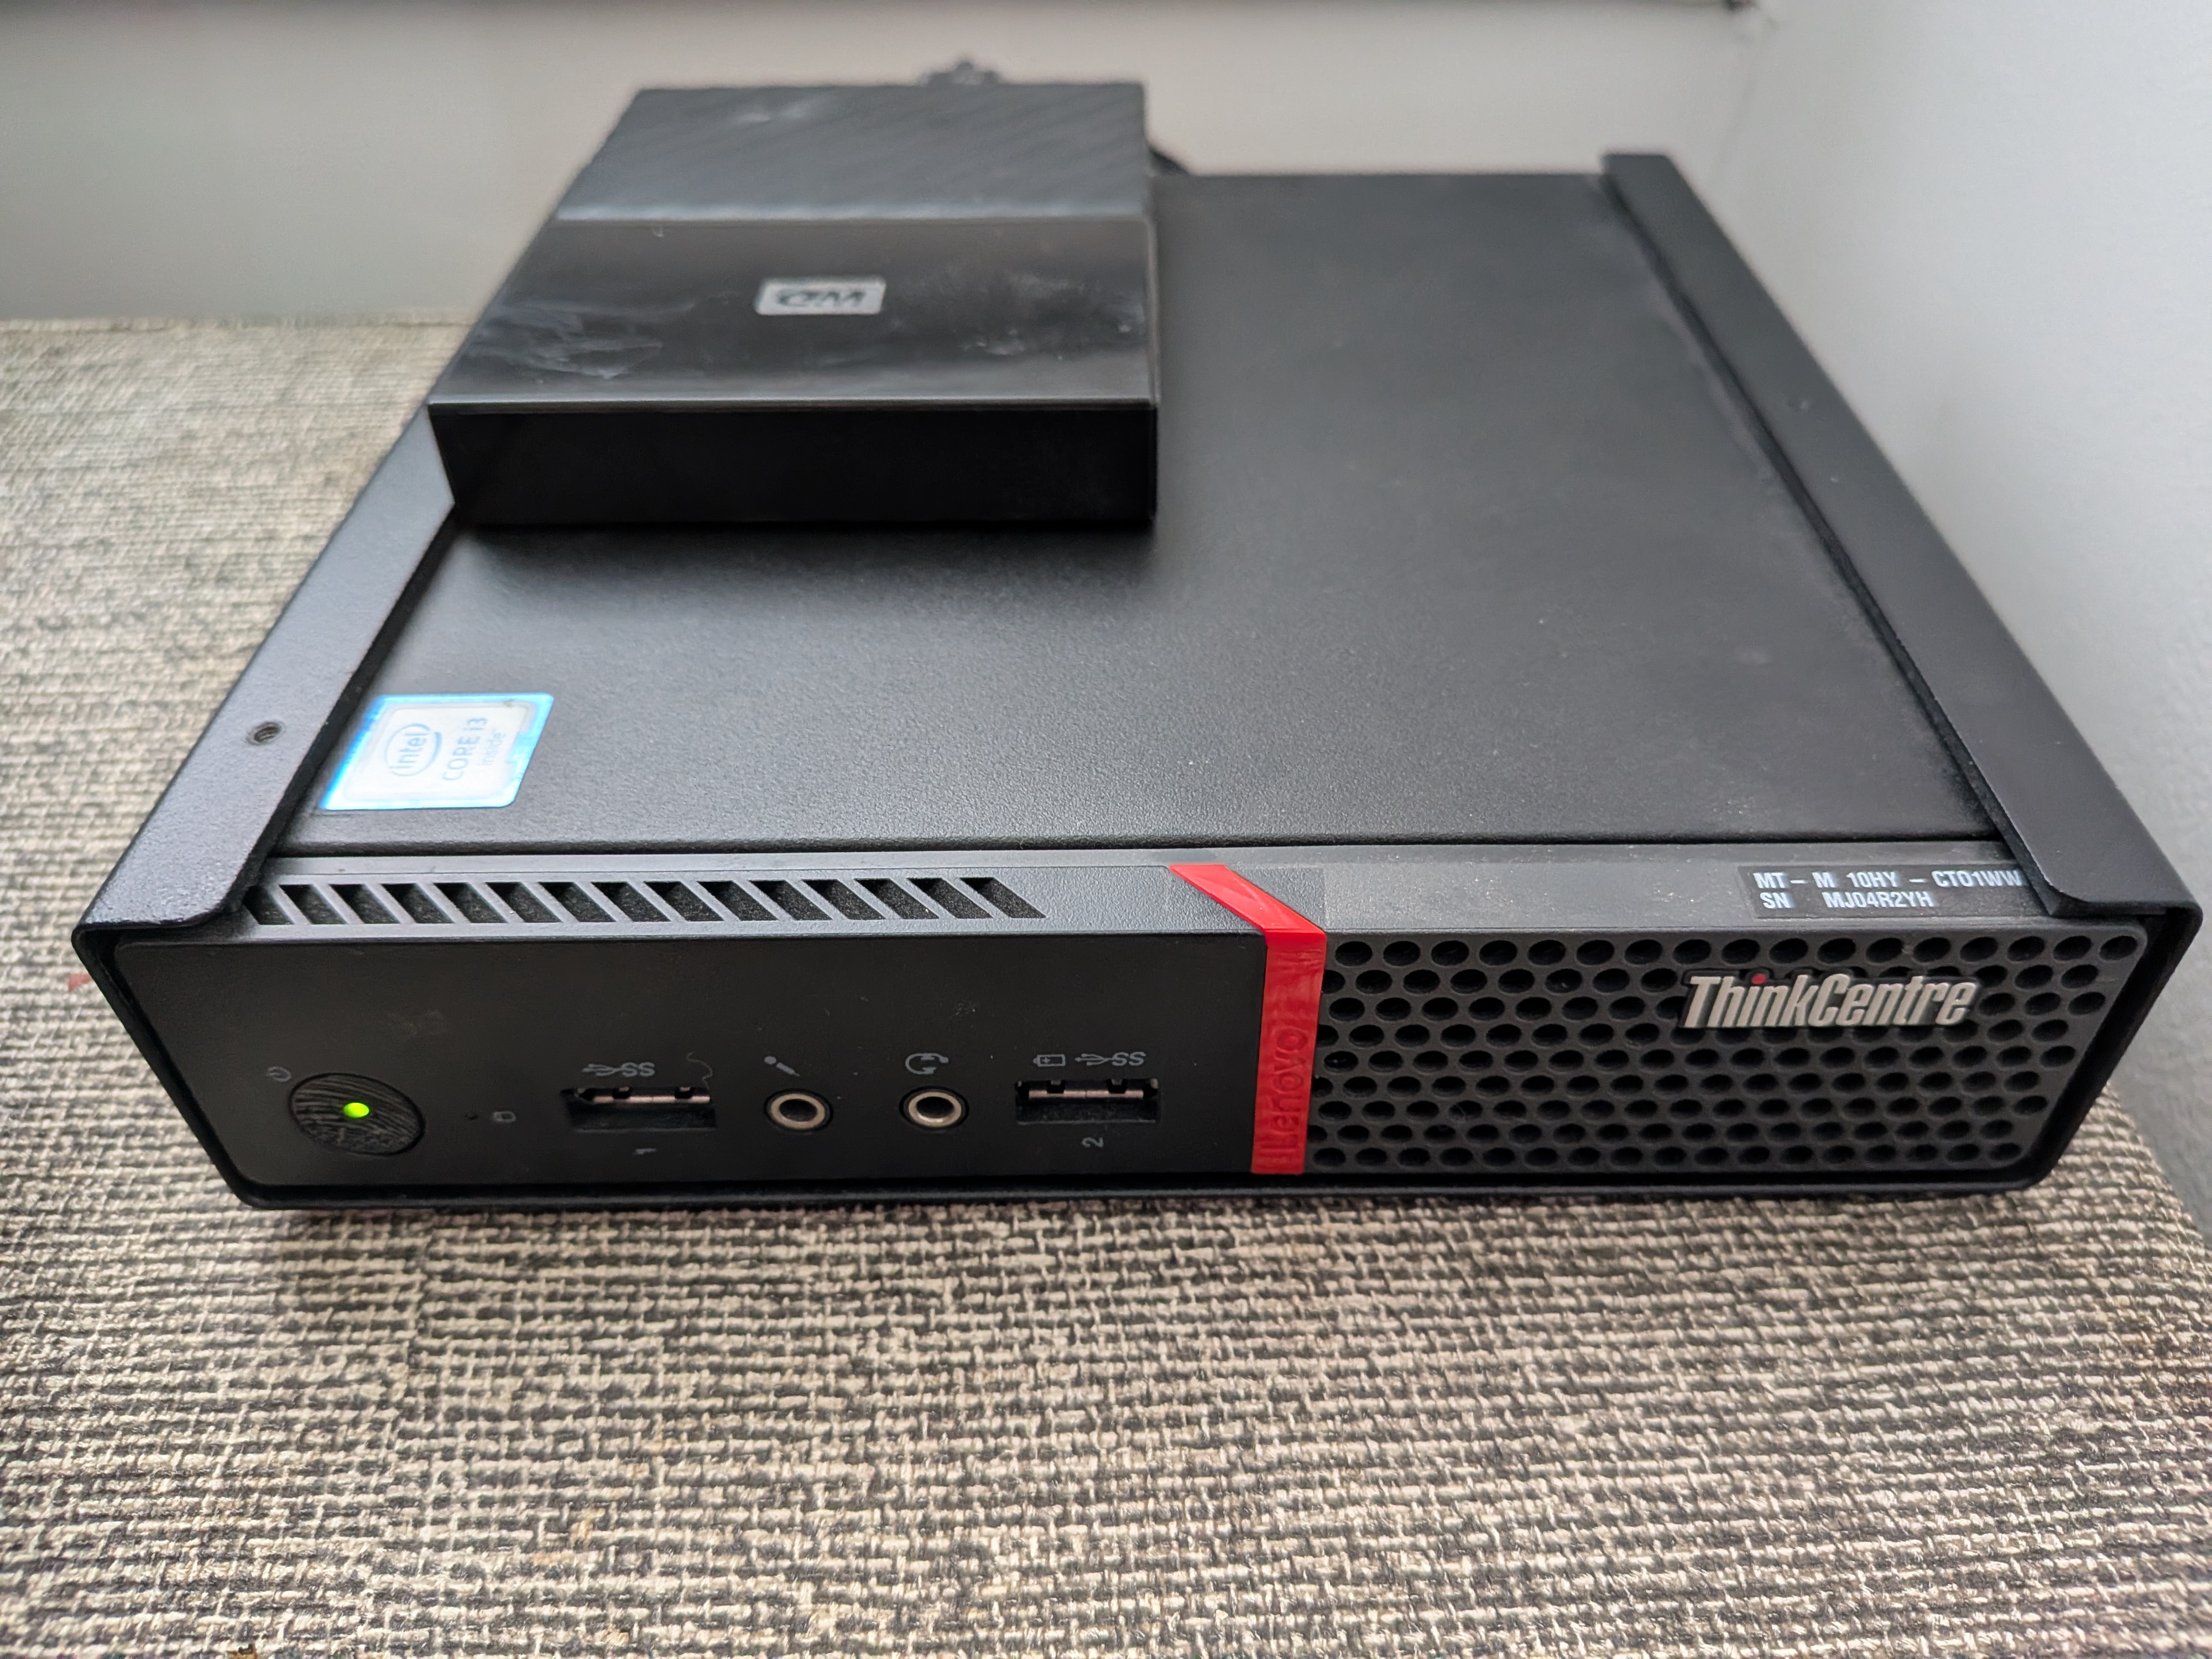
Server: Kafka + Postgres + Metabase
Kafka: The Broker in the Middle
Kafka runs in Docker (apache/kafka:3.7.0) on the home server, exposed on
port 9092. Two topics carry the data: sensor-readings for DHT22 readings
and metar-readings for weather reports. Both are configured with a 7-day
retention window — long enough to replay if a consumer falls behind, short enough not
to chew through disk.
docker exec kafka /opt/kafka/bin/kafka-configs.sh \
  --bootstrap-server localhost:9092 \
  --alter --entity-type topics \
  --entity-name sensor-readings \
  --add-config retention.ms=604800000
Consumers: Python + systemd
Two Python scripts run as long-lived systemd services on the server. Each one subscribes
to a Kafka topic and inserts rows into Postgres using psycopg2.
They live in ~/kafka_consumer/ alongside a dedicated virtualenv, and they
are configured to restart automatically with a 10-second backoff.
[Unit]
Description=Kafka Sensor Consumer
After=network.target docker.service
Requires=docker.service

[Service]
User=ian
WorkingDirectory=kafka_consumer
ExecStart=kafka/bin/python3 \
  sensor-consumer.py
Restart=always
RestartSec=10
The same pattern applies to the METAR consumer. With both services registered in systemd,
a single systemctl enable --now sensor-consumer metar-consumer is all that's
needed after a server rebuild.
Postgres: Storage and Retention
Postgres runs in Docker with data in a named volume
(docker-compose-yaml_postgres_data). The database is sensor_logs
and the primary table is sensor_readings, timestamped and indexed for
time-series queries.
Because source data lives in Kafka, Postgres doesn't need to be the system of record — it's the fast query layer. That framing justified two performance choices:
- synchronous_commit off — eliminates the WAL fsync on every write. Safe here because Kafka retains the raw data; a crash means at most a few seconds of rows are lost, not the entire dataset.
-
3-day rolling retention — a systemd timer deletes rows older than
72 hours at 3am and runs
VACUUM ANALYZEto reclaim space. This keeps the table lean and queries fast without manual intervention.
docker exec docker-compose-yaml-db-1 psql -U postgres -d sensor_logs -c \
  "DELETE FROM sensor_readings WHERE ts < NOW() - INTERVAL '3 days';
   VACUUM ANALYZE sensor_readings;"
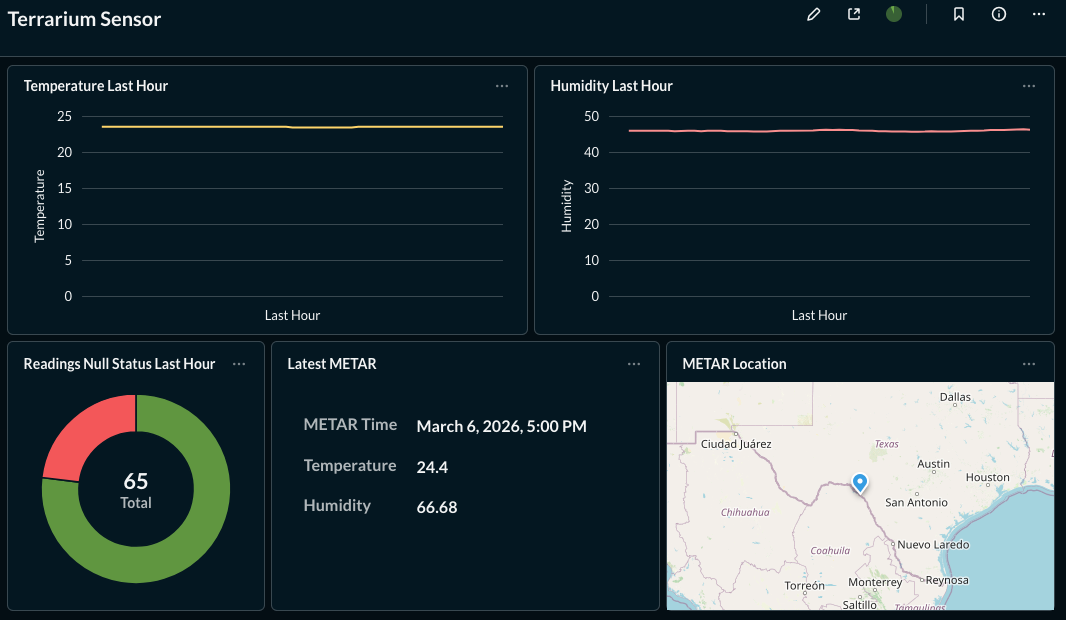
Metabase: Dashboards
Metabase connects to Postgres via the Docker bridge gateway
(172.17.0.1:5454) — the address containers use to reach host-mapped ports.
Dashboards show temperature and humidity trends alongside METAR data, making it easy
to compare indoor conditions to outdoor weather.
Metabase's application database (H2) is stored in a named Docker volume rather than
the container's overlay layer. In the original setup
the H2 database lived only in the container, so when the drive died, every dashboard
and saved question was gone. A named volume survives docker rm, gets
included in backups, and is portable.
docker run -d --name metabase --restart always -p 3000:3000 \
  -v metabase_data:/metabase.db \
  -e MB_DB_FILE=/metabase.db/metabase.db \
  metabase/metabase
After setting up Metabase's initial admin account, the Postgres database connection is registered via the API — useful for scripted rebuilds so no manual UI steps are needed to reconnect data sources.
Disk Health and Log Management
A home server running 24/7 needs a few guardrails to prevent slow-motion disk failure from becoming a sudden data loss event.
-
SMART monitoring —
smartmontoolstracks drive health metrics continuously.sudo smartctl -a /dev/sdagives a full health report. -
Docker log rotation — without limits, Docker's JSON logs grow
unboundedly.
/etc/docker/daemon.jsoncaps each log at 10MB with 3 rotations. - Kafka retention — 7-day topic retention means Kafka's storage footprint is bounded and predictable.
{
  "log-driver": "json-file",
  "log-opts": {
    "max-size": "10m",
    "max-file": "3"
  }
}
Backups
A USB drive holds nightly backups, managed by a systemd timer that runs at 2am. The backup script does three things:
- Dumps
sensor_logsviapg_dumpto/mnt/usb/backups/ - Tarballs the
metabase_dataDocker volume - Rotates files older than 14 days
The USB drive is registered in /etc/fstab with the nofail
flag so the server boots normally even if the drive isn't present.
The Drive Failure and Recovery
The original server drive failed. Using ddrescue, a full 466GB image was
recovered to the USB drive with no bad sectors — the filesystem was clean. From that
image, everything that mattered was extracted:
- Docker Compose files and Kafka consumer scripts
- The Postgres volume (88MB of intact data)
What was not recoverable: the Kafka topic data (the volume was empty — messages had already been consumed and committed to Postgres) and the Metabase dashboards (the H2 database lived in the container overlay layer, not a named volume).
Rebuilding was straightforward because the pipeline's components are stateless or externally reproducible. Compose files are declarative. Consumer scripts are in version control. Postgres data was on the rescued image. The dashboards had to be recreated — which is now prevented by the named volume.
What This Stack Demonstrates
- End-to-end pipeline design from hardware sensor to analytics dashboard
- Kafka as a durable buffer between producers and consumers
- Postgres performance tuning for write-heavy time-series workloads
- systemd for process supervision, scheduling, and service lifecycle management
- Docker volume strategy and the difference between named volumes and overlay storage
- Disk health monitoring and bounded storage via tiered retention policies
- Data recovery from a failed drive and stateless rebuild from recovered artifacts