Computer Vision / ML
TensorFlow Object Detection on Lancaster City Row Houses
An exploration in machine learning using TensorFlow object detection models trained on street-level imagery of Lancaster City, PA row houses.
If a model can be trained to detect row houses of varying styles, can it eventually tell us about the visual makeup of different areas within a city — and can that be coupled with residents' own definitions of their neighborhood boundaries?
Background
There have been several conceptualizations of neighborhood definitions in Lancaster City over the past 40 years. This project asks whether machine learning object detection — trained on street-view imagery — can produce a visual representation of neighborhoods that reflects residents' lived experience of their neighborhood boundaries, rather than boundaries drawn by planners or administrators.
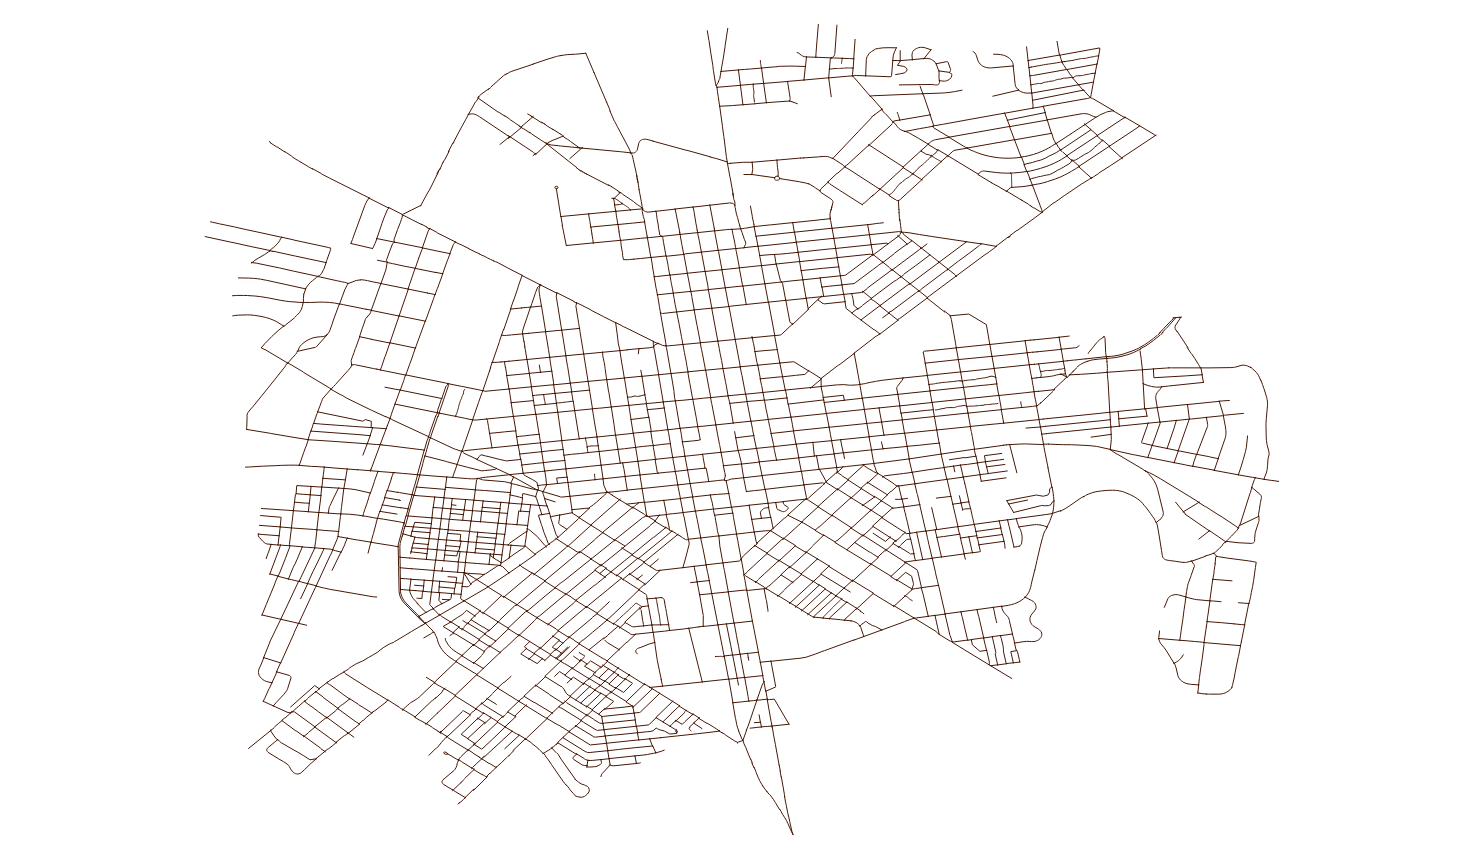
The approach: train a TensorFlow model to detect row houses from Google Street View images collected along every street in the city, then explore whether detection patterns align with historically defined neighborhood boundaries.
TensorFlow Setup
The model was built following a TensorFlow object detection tutorial. A few notes from the process:
- The CPU variant of TensorFlow was used — no GPU required
- Anaconda was not used; in hindsight it would simplify environment management
- Step-by-step tutorial instructions were clear and well-documented
- The Jupyter Notebook instance would not render result images inline due to a backend configuration issue — output images were redirected to disk instead
- Renaming the project directory mid-setup broke VirtualEnv paths; fixed by updating them manually inside the virtualenv
- The webcam detection section was skipped
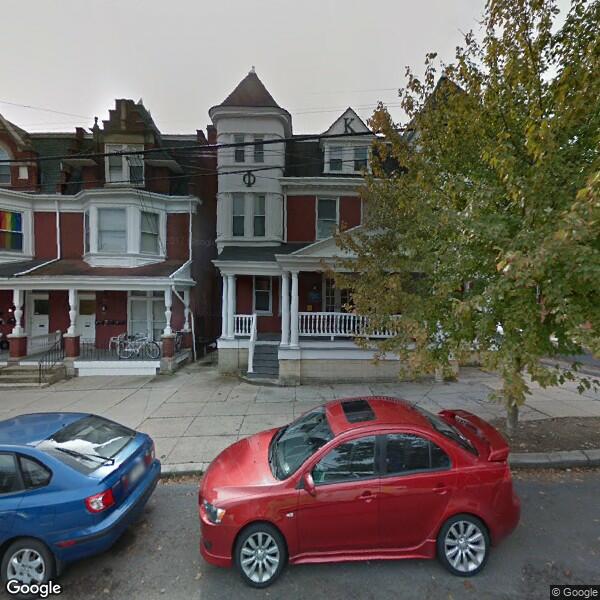
Collecting Training Images
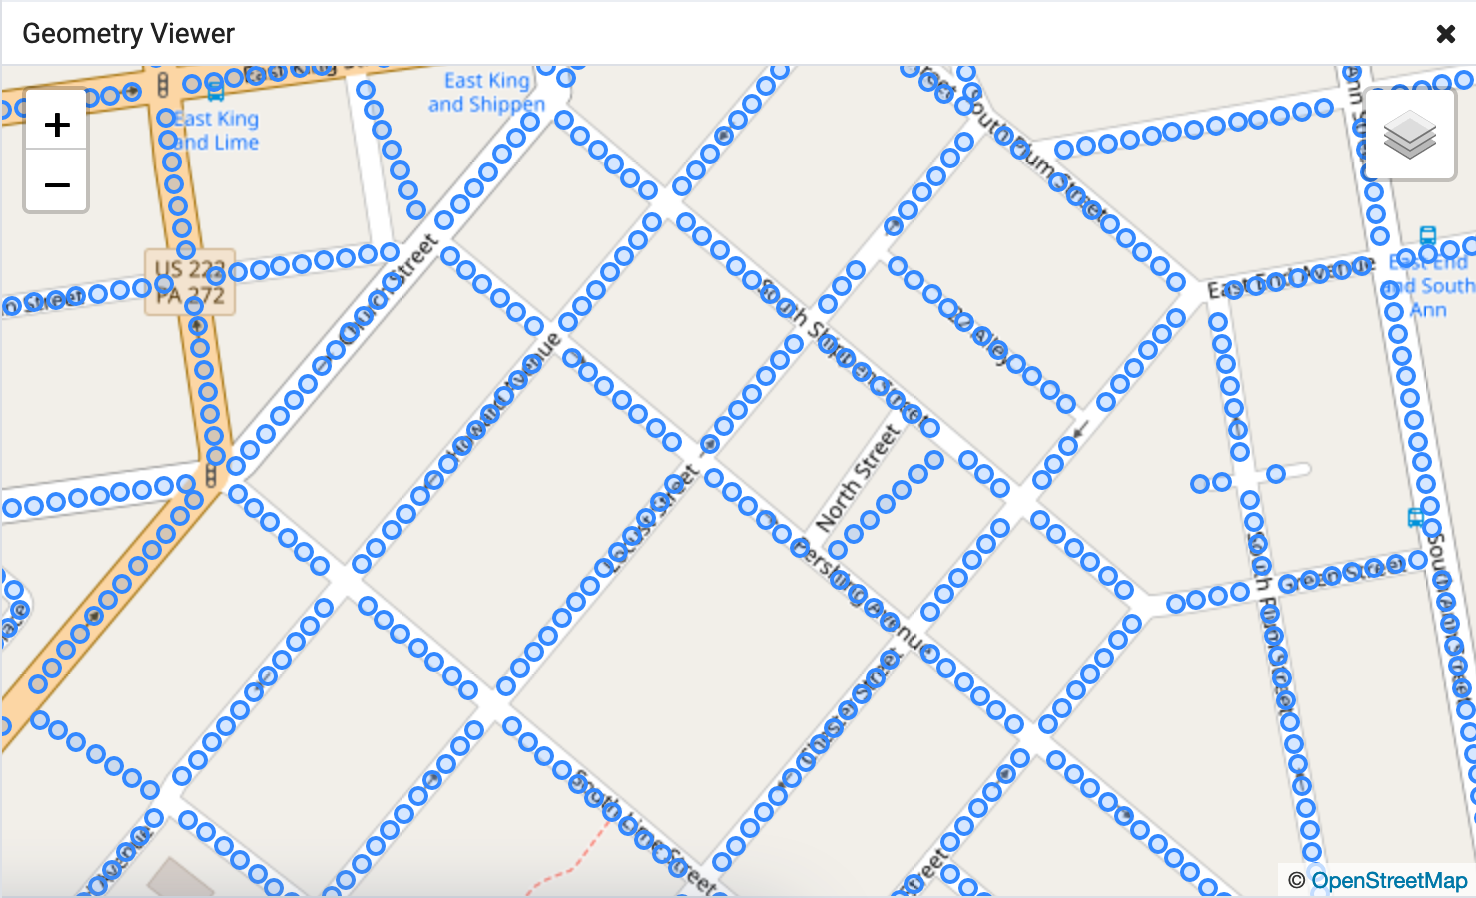
500 images were collected from the Google Street View Static API. The pipeline has three steps: generate sample points along every street, query the API for each point in both perpendicular directions, and download the images.
Street View API Parameters
- API Key — obtained through Google Cloud registration
- Location — latitude and longitude of each sample point
- Size — 600×600 px output
- Heading — compass direction (0° and 360° are grid north)
- Radius — 10 m search radius to find a Google panorama ID
Generating Sample Points with PostGIS
Street geometries for Lancaster City were downloaded from Census TIGER/Line files, imported into PostgreSQL/PostGIS, filtered by feature class to streets only, and clipped to a bounding box covering the city boundary.
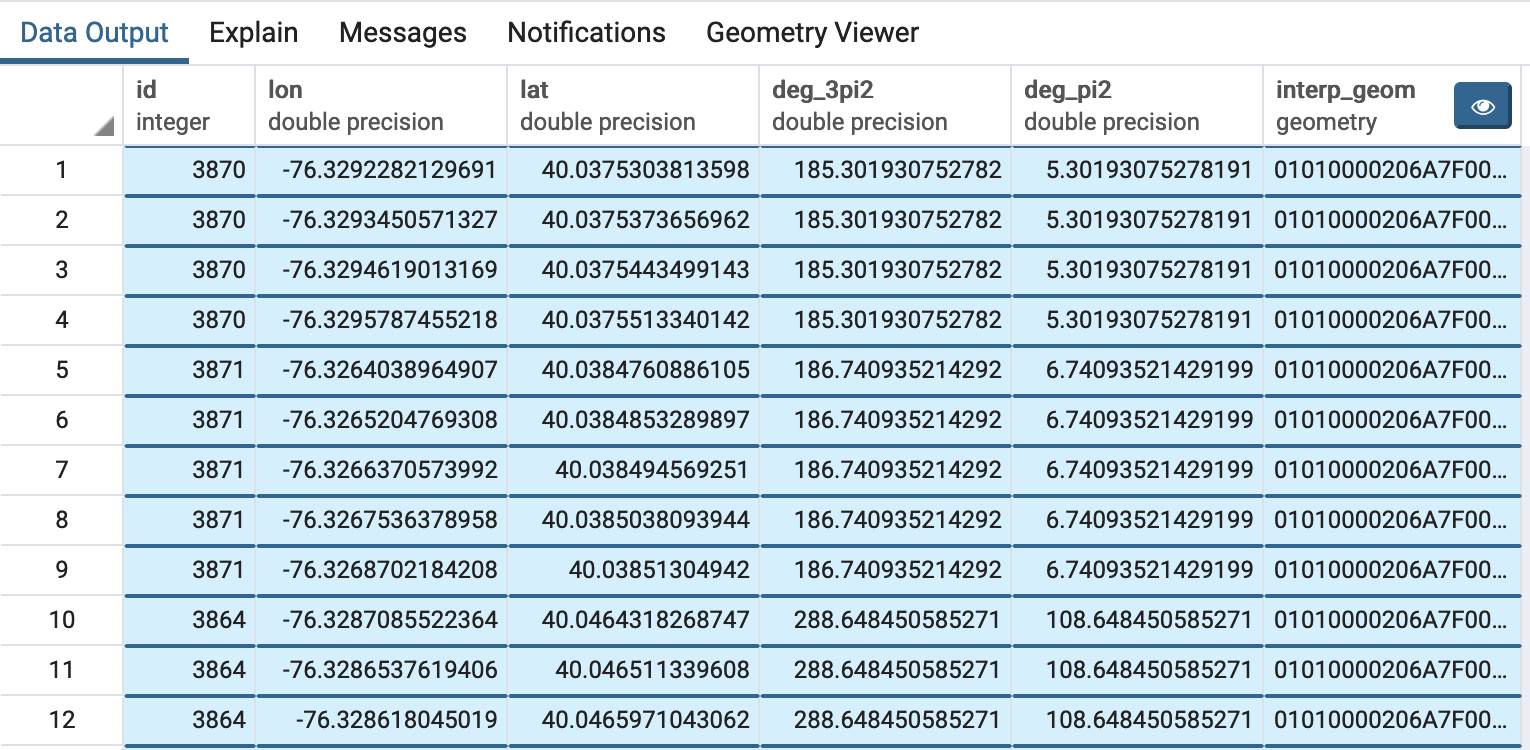
The following query extracts a point every 10 meters along each street, along with perpendicular headings in both directions for the Street View API calls.
WITH
  -- Transform geometries to work in meters
  geom_transform AS (
    SELECT id, (ST_Dump(ST_Transform(geom, 32618))).geom AS geom
    FROM lanco_edges_tl2018
  ),
  -- Extract length, remainder, azimuth, and start offset for even spacing
  line_attrs AS (
    SELECT *,
      ST_Length(geom) og_length,
      round(ST_Length(geom))::integer
        - mod(round(ST_Length(geom))::integer, 10) sub_line_length,
      ST_Azimuth(ST_StartPoint(geom), ST_EndPoint(geom)) az,
      (mod(round(ST_Length(geom))::integer, 10)::double precision / 2)
        / ST_Length(geom) start_pct
    FROM geom_transform
  ),
  -- Generate a point every 10 meters along each street
  points_series AS (
    SELECT *,
      generate_series(
        (og_length * start_pct)::integer + 10,
        sub_line_length - 1,
        10
      ) interp_dist
    FROM line_attrs
  ),
  -- Compute perpendicular headings and interpolated point geometry
  azimuths AS (
    SELECT *,
      degrees(az + (3 * pi() / 2)) deg_3pi2,
      degrees(az + pi() / 2)       deg_pi2,
      ST_LineInterpolatePoint(
        (ST_Dump(geom)).geom,
        interp_dist / og_length
      ) interp_geom
    FROM points_series
  )
SELECT
  id,
  ST_X(ST_Transform(interp_geom, 4326)) lon,
  ST_Y(ST_Transform(interp_geom, 4326)) lat,
  CASE WHEN deg_3pi2 > 360 THEN deg_3pi2 - 360 ELSE deg_3pi2 END,
  CASE WHEN deg_pi2  > 360 THEN deg_pi2  - 360 ELSE deg_pi2  END,
  interp_geom
FROM azimuths;
Downloading Images
For each sample point the script first calls the metadata endpoint to check whether a Street View panorama exists. If one is available it downloads images for both perpendicular headings.
import requests, shutil, csv, json

api_streetview_url = "https://maps.googleapis.com/maps/api/streetview"
api_metadata_url   = "https://maps.googleapis.com/maps/api/streetview/metadata"
api_key = '*'

def sv_api_call_save_image(url, params, filename):
    sv_request = requests.get(url, params=params, stream=True)
    with open(filename, 'wb') as f:
        sv_request.raw.decode_content = True
        shutil.copyfileobj(sv_request.raw, f)

def sv_api_call_has_results(url, params):
    sv_request = requests.get(url, params=params)
    md_json = json.loads(sv_request.text)
    if md_json["status"] == 'ZERO_RESULTS':
        return (False, None)
    return (True, md_json)

with open(sv_locations_csv, mode='r') as csv_file:
    csv_reader = csv.DictReader(csv_file)
    for row in csv_reader:
        params = {
            "size":     "600x600",
            "location": "{lat},{lon}".format(
                            lat=row["lat"][0:9], lon=row["lon"][0:10]),
            "key":      api_key,
            "radius":   5,
        }
        has_results = sv_api_call_has_results(api_metadata_url, params)
        if has_results[0]:
            pano_id = has_results[1]["pano_id"]
            for heading_key, suffix in [("deg_3pi2", "deg_3pi2"), ("deg_pi2", "deg_pi2")]:
                params["heading"] = row[heading_key]
                filename = "{dir}{id}-{pano}-{sfx}.png".format(
                    dir=sv_images_dir, id=row["id"],
                    pano=pano_id, sfx=suffix)
                sv_api_call_save_image(api_streetview_url, params, filename)
Training the Model
- Objects in each training image were drawn and labeled using LabelImage
- The default model from the TensorFlow object detection tutorial was used as the base
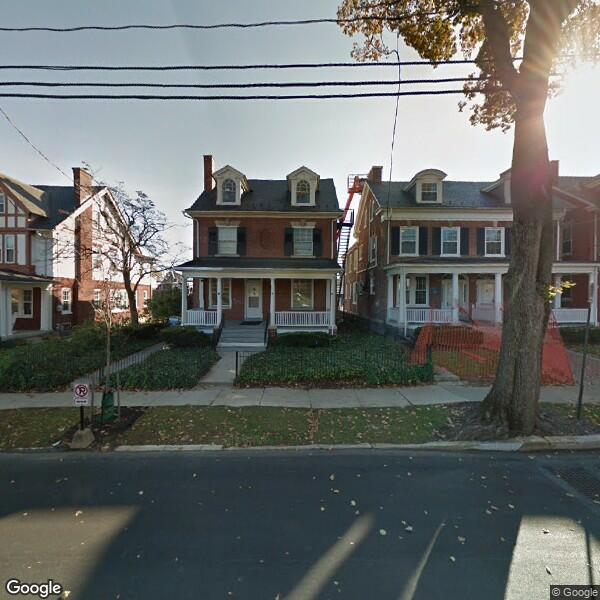
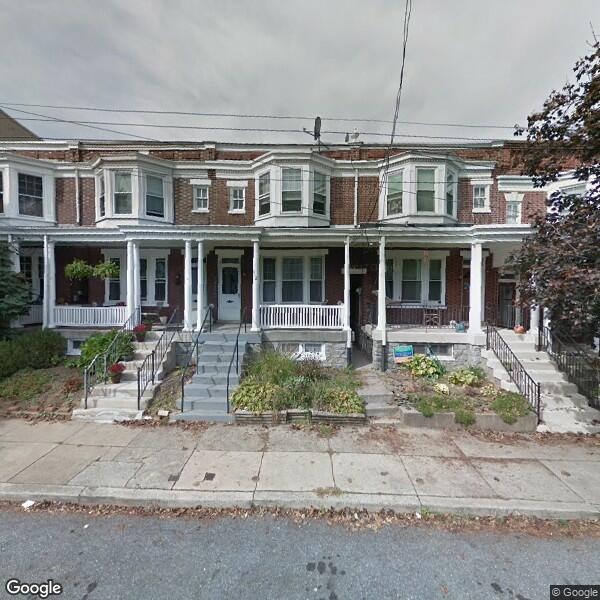
Images were downloaded through the Google Street View API and paid for with a personal account. They are published here for demonstration purposes only and may not be used or referenced for other purposes.
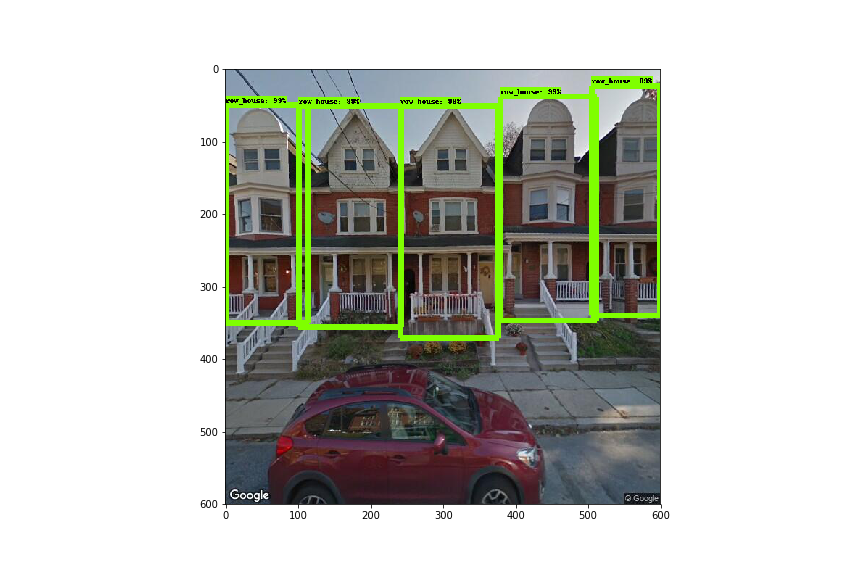
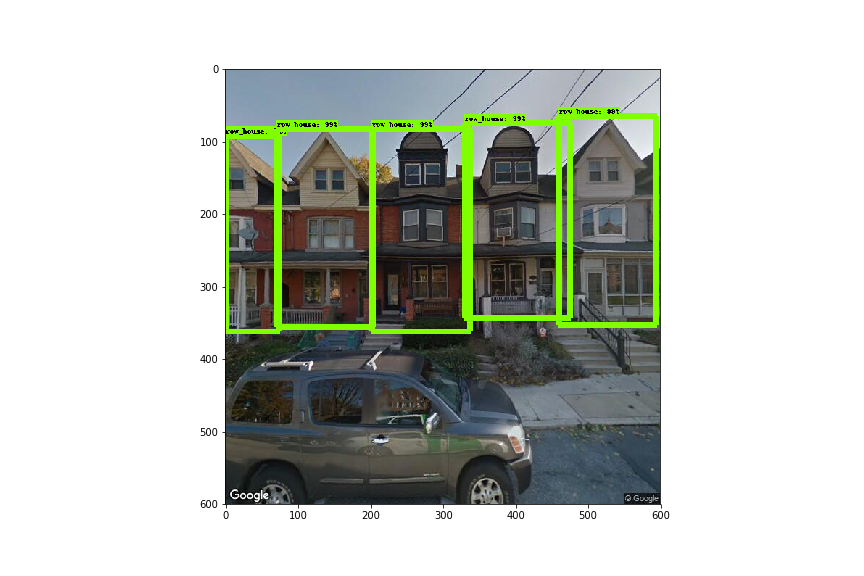
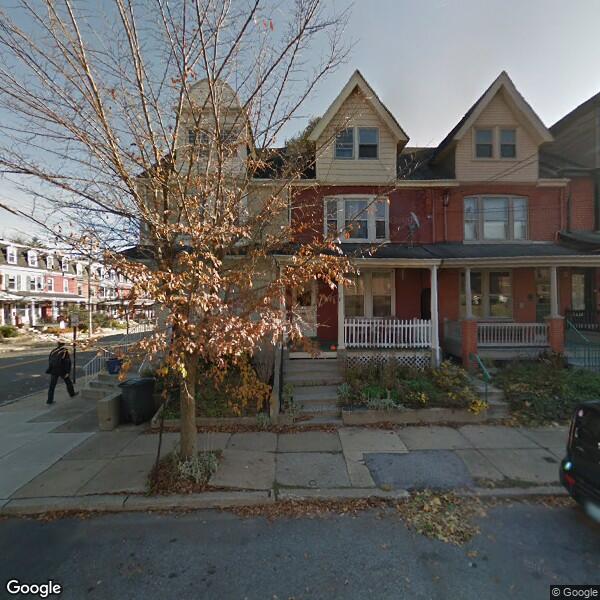
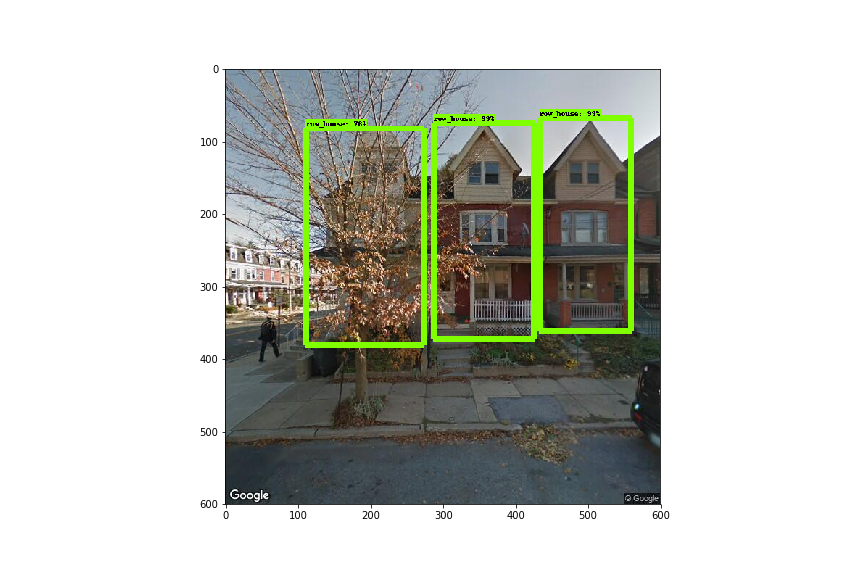
Detection Results
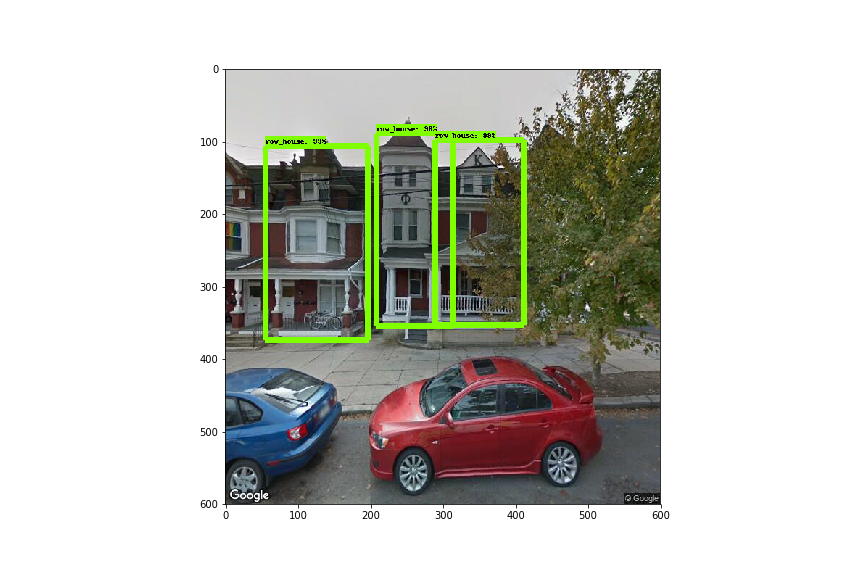
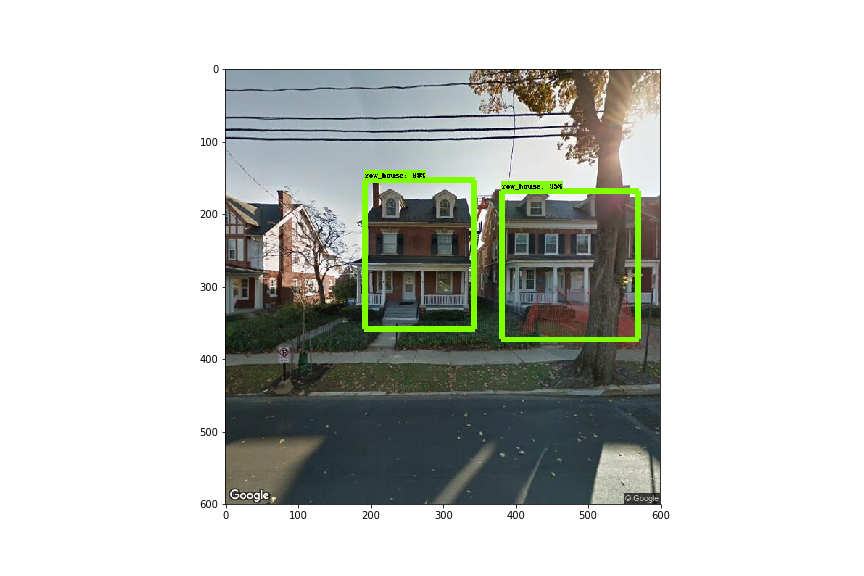
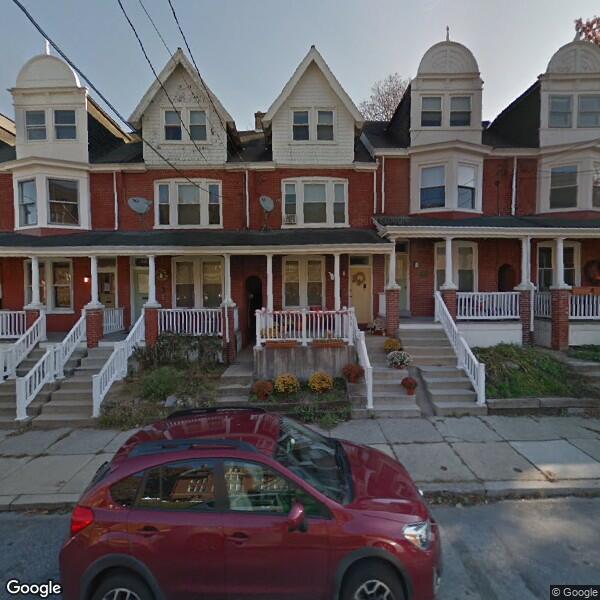
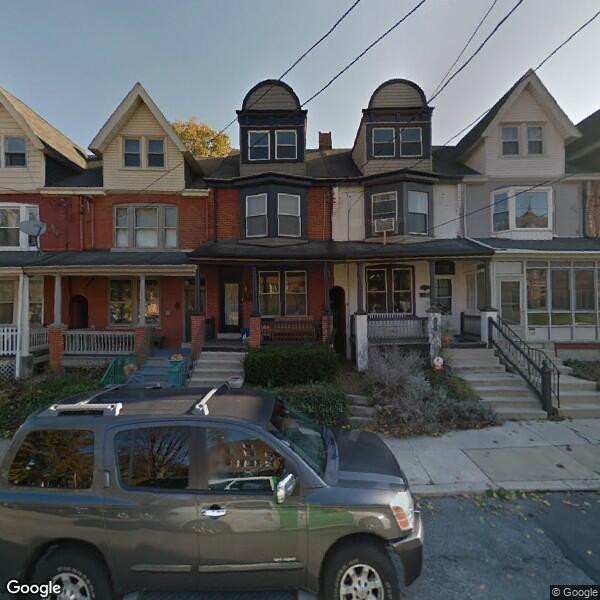
Each pair below shows the original Street View image alongside the model's detection output. Green boxes indicate detected row houses.
Detection of buildings that aren't row houses
Overlap or missed features
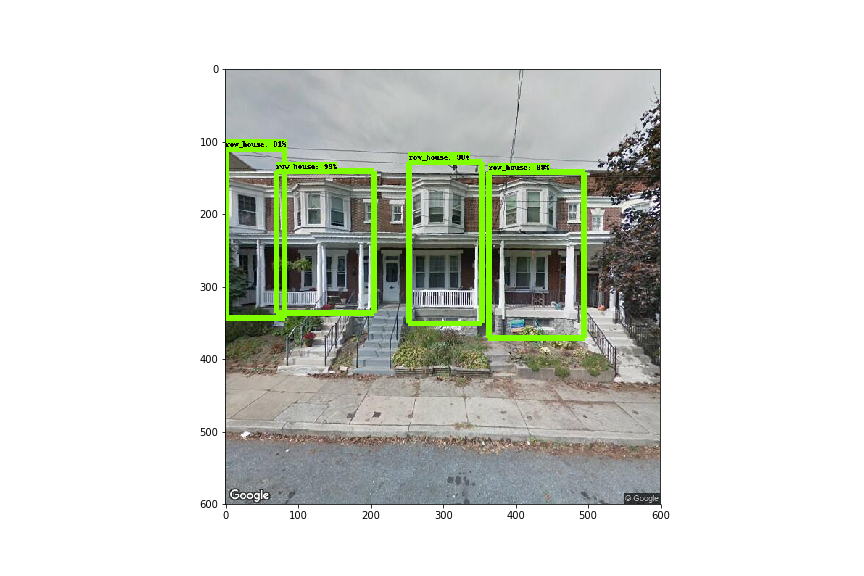
Accurate detection — peaked rooflines as a strong feature
Detection through obstacles
Next Steps
With the proof of concept working, the path forward:
- Train on more images with multiple label categories for different row house types
- Investigate model architecture and hyperparameters to improve accuracy
- Explore whether labels can be derived from location to detect visually similar areas
- Compare model-derived area boundaries with residents' perceptions of their neighborhood